

Read 2 of 5
Marginal revenue
What does one more sale really add to revenue?
In Week 2, every vehicle Auto Eco sold brought in the market price. So one more vehicle added exactly the same price to revenue, and Auto Eco expanded until marginal cost reached the price.
Ride On can't sell one more ride at the current price. To sell it, Ride On must lower the price, and because every child pays the same price, it lowers the price on every ride. So one more ride adds its price to revenue, but it also takes something away: the discount on all the rides that would have sold anyway.
This reading measures that discount. The measure is called marginal revenue, and it does for the revenue side what marginal cost does for the cost side.
2.1
Total and average revenue
is the price times the quantity sold. For a firm with market power, the price depends on the quantity, so
For Ride On,
Revenue is quadratic in \(Q\), just like the quadratic cost functions in Week 1. Move the point along demand in the top panel and watch revenue change in the bottom panel.
Revenue rises at first, peaks at 70 rides and then falls. Selling more rides isn't always good for revenue, because selling more means charging less. Past 70 rides, the lower price costs more than the extra rides bring in.
is revenue per unit, \(R(Q)/Q\). Every ride sells at the same price, so average revenue is simply the price, \(p(Q)\). In other words, the demand curve is the average-revenue curve.
2.2
Selling more means a discount on every unit
Suppose Ride On sells 40 rides a day at $2.50 and considers selling 50 instead. To sell 50 rides, the price must fall to \(p(50)=2.25\). Revenue changes for two reasons.
New revenue. The ten extra rides each sell for $2.25. That adds \(10\times2.25=22.50\) dollars.
Lost revenue. The 40 children who were already riding at $2.50 now pay $2.25 too. Each pays 25 cents less, so Ride On loses \(40\times0.25=10\) dollars on rides it would have sold anyway.
So revenue rises by \(22.50-10=12.50\), from $100 to $112.50. The ten extra rides bring in $22.50, but the net gain is only $12.50. The difference is the discount Ride On has to give its existing customers.
is the change in total revenue from selling one more unit. Over this step, revenue rises by $12.50 for ten extra rides, or about $1.25 per extra ride. Each extra ride sells for $2.25, but adds only about $1.25 to revenue. The gap between the price and marginal revenue is the cost of the discount.
The same logic works for any change in quantity. Start from a price and quantity pair \((p,Q)\) on the demand curve. Suppose the firm sells \(\Delta Q\) more units. To sell them, the price has to change by \(\Delta p\), so it goes from \(p\) to \(p+\Delta p\). Demand slopes down, so \(\Delta p\) is negative. Quantity goes from \(Q\) to \(Q+\Delta Q\).
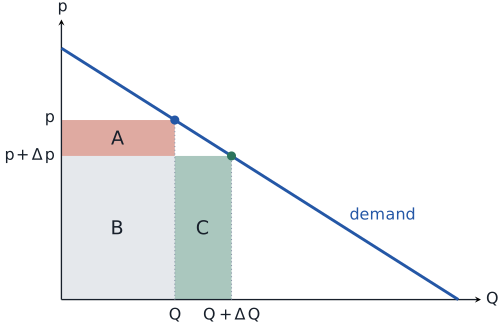
Before the change, revenue is \(p\times Q\), the area \(A+B\). After the change, revenue is \((p+\Delta p)\times(Q+\Delta Q)\), the area \(B+C\). Area \(B\) is in both, so the change in revenue is
Area \(C\) is the new revenue: \(\Delta Q\) extra units, each sold at the new price \(p+\Delta p\). Area \(A\) is the lost revenue: the \(Q\) units that would have sold anyway now sell for \(-\Delta p\) less each. We write \(-\Delta p\) because \(\Delta p\) is negative and an area has to be positive.
Marginal revenue is the change in revenue for each extra unit, so we divide the change in revenue by \(\Delta Q\):
If revenue is continuous in \(Q\), we can make the change in \(Q\) infinitesimally small. As \(\Delta Q\) tends to zero, \(\Delta p\) also tends to zero, and the formula becomes
The first part, \(p+\Delta p\), is the price at which the extra units sell. The second part, \(Q\times\Delta p/\Delta Q\), is the discount on the units that would have sold anyway, for each extra unit. It's negative, because \(\Delta p/\Delta Q\) is negative.
Check it with Ride On's step from 40 to 50 rides. Here \(p+\Delta p=2.25\), \(Q=40\) and \(\Delta p/\Delta Q=-0.25/10=-0.025\), so
which is the $1.25 per extra ride we found above. In the graph below, \(A\) is the red strip, \(B\) is the gray area and \(C\) is the green strip.
As you move right, the red strip gets longer. The price cut needed to sell ten more rides is always 25 cents, but it applies to more and more existing rides. At the same time the green strip gets shorter, because the extra rides sell at a lower and lower price. Eventually the lost revenue catches up with the new revenue, and after that it's larger.
Predict before you move the graph
Ride On currently sells 80 rides a day. It considers lowering the price to sell 90. What happens to revenue?
Revenue falls by $7.50. The price drops from $1.50 to $1.25. The ten extra rides add \(10\times1.25=12.50\), but the 80 existing rides each lose 25 cents, which costs \(80\times0.25=20\). Past 70 rides, the discount on existing sales outweighs the new sales.
2.3
Marginal revenue
The ten-ride step gives an approximation. To find marginal revenue exactly, we apply the same method to revenue that we applied to cost in Week 1. Ride On's revenue, \(R(Q)=3.5Q-Q^2/40\), has the same form as the quadratic cost function \(C(q)=a+bq+cq^2\), with \(a=0\), \(b=3.5\) and \(c=-1/40\). In Week 1, marginal cost was \(b+2cq\). So for Ride On,
Check it against the ten-ride step. The step from 40 to 50 rides averaged $1.25 per ride. Marginal revenue at the middle of that step, 45 rides, is \(MR(45)=3.5-45/20=1.25\). The two methods agree exactly here because revenue is quadratic, so its slope changes at a constant rate.
The general version shows where the gap between price and marginal revenue comes from. For any demand curve, marginal revenue is
Each term matches one of the strips. The first term, \(p(Q)\), is the new revenue: the price the extra unit sells for. The second term is the lost revenue. Here \(dp/dQ\) is how much the price must change to sell one more unit, and it applies to all \(Q\) units already being sold. Demand slopes down, so \(dp/dQ\) is negative, the second term is negative, and marginal revenue is below the price at every positive output.
Demand for the firm's output is flat at the market price, so \(dp/dQ=0\) and \(MR(Q)=p\).
Demand slopes down, so \(dp/dQ\lt 0\) and \(MR(Q)\lt p\).
So Week 2's rule, expand until price equals marginal cost, was really "expand until marginal revenue equals marginal cost" for a firm whose marginal revenue happens to equal the price.
2.4
The linear rule
Most problems in this course use linear demand, so one shortcut is worth remembering. If inverse demand is \(p(Q)=a-bQ\), then
Marginal revenue has the same intercept as inverse demand and twice the slope. So the marginal-revenue line starts at the same point on the price axis and falls twice as fast. It reaches zero halfway to the quantity at which demand reaches zero.
For Ride On, \(a=3.5\) and \(b=1/40\), so \(MR(Q)=3.5-Q/20\), which matches what we found above. Demand reaches zero at 140 rides and marginal revenue reaches zero at 70.
That point at 70 rides matters. Below 70, marginal revenue is positive and selling one more ride raises revenue. Above 70, marginal revenue is negative and selling one more ride lowers revenue. At exactly 70, revenue is at its peak of $122.50, which is what the graph showed.
2.5
Marginal revenue isn't the price of the last unit
The most common error with marginal revenue is to treat it as the price at which the last unit sells. At 40 rides, the 40th ride sells for $2.50. But marginal revenue at 40 rides is \(MR(40)=3.5-40/20=1.50\), a dollar less. The extra ride brings in $2.50 from the child who takes it, and costs Ride On a small discount on the 39 rides it was already selling.
So it helps to keep the two curves apart. The demand curve tells you what the next buyer pays. The marginal-revenue curve tells you what the next sale adds to the firm's revenue. For a price-taker the two are the same. For a firm with market power they aren't, and the gap grows as output grows, because the discount applies to more and more units.
There's a managerial version of the same point. A sales team that counts the revenue from each new customer at the price that customer pays will overstate what the extra sales are worth whenever winning those customers requires a lower price for everyone.
Summary