In most weeks, market demand for long-stem roses is approximately
Market demand\(Q^d(p)=2{,}400-50p\)
where \(p\) is the price of a dozen roses in dollars and \(Q^d(p)\) is the total number of dozens buyers want each week at that price.
The roses come from 100 identical growers. Each grower’s weekly cost of growing \(q\) dozen roses is
One grower\(C(q)=0.25q^2+0.5q+36\)
The fixed cost of $36 is avoidable: a grower who grows nothing in a given week doesn’t pay it. The number of growers stays at 100 throughout.
Question 1
Find one grower’s supply curve. Describe it both as an equation and on a graph.
Question 2
Derive the market supply curve.
Question 3
Find the equilibrium price of a dozen roses and the quantity sold. On one graph, draw the market supply and market demand curves and mark the equilibrium.
Question 4
In the weeks around Valentine’s Day, market demand rises to
Valentine’s Day demand\(Q^d(p)=6{,}150-50p\)
Assuming supply doesn’t change, find the new equilibrium price.
Question 5
Suppose the city government passes a law that caps the price of roses at $20 a dozen. A law like this is called a price ceiling: sellers may not charge more than $20. Using a graph, show and explain what happens in the market for roses around Valentine’s Day.
Reveal the solution
Solutions: The market for roses
Question 1
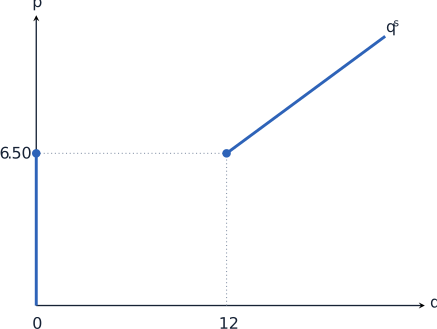
A grower's supply curve has two parts: the price below which the grower doesn't produce at all, and how much the grower produces above that price.
The shutdown threshold
Since the $36 fixed cost is avoidable, a grower produces only if the price covers average cost. The lowest price that does is the minimum of average cost. Average and marginal cost are
One grower's costs\(AC(q)=0.25q+0.5+\dfrac{36}{q},\qquad MC(q)=0.5q+0.5\)
Average cost is lowest where it equals marginal cost:
Minimum average cost\(0.25q+0.5+\dfrac{36}{q}\)\(=\)\(0.5q+0.5\)\(\dfrac{36}{q}\)\(=\)\(0.25q\)\(q^2\)\(=\)\(144\)\(q\)\(=\)\(12\)
At 12 dozen, average cost is \(AC(12)=3+0.5+3=6.5\). So the shutdown threshold is $6.50 a dozen.
Output above the threshold
Above $6.50, the grower produces where price equals marginal cost:
The price of $10 is above the $6.50 threshold, so this is the right piece of the supply curve. The quantity is \(Q^e=200\times10-100=1{,}900\) dozen a week, or 19 dozen per grower.
On the graph, demand is a downward-sloping line from $48 on the price axis, where \(Q^d=0\), to 2,400 dozen on the quantity axis. Market supply follows the shape from Question 1, scaled up 100 times: zero below $6.50, a jump to 1,200 at $6.50, then rising along \(Q^s=200p-100\). The curves cross at $10 and 1,900 dozen.
Question 4
Around Valentine's Day, demand shifts right. Supply doesn't change, so repeat the calculation with the new demand:
Valentine's Day equilibrium\(6{,}150-50p\)\(=\)\(200p-100\)\(6{,}250\)\(=\)\(250p\)\(p^e_v\)\(=\)\(25\)
The subscript \(v\) marks the Valentine's Day equilibrium. The new quantity is \(Q^e_v=200\times25-100=4{,}900\) dozen. The price rises from $10 to $25, and growers move up their supply curves, each growing 49 dozen instead of 19.
Question 5
A price ceiling matters only if it's below the price the market would otherwise reach.
In ordinary weeks
The equilibrium price is $10, below the $20 ceiling, so the law has no effect.
Around Valentine's Day
The equilibrium price would be $25, so the ceiling stops the price from getting there. At $20:
Demand and supply at the ceiling\(Q^d(20)\)\(=\)\(6{,}150-50\times20=5{,}150\)\(Q^s(20)\)\(=\)\(200\times20-100=3{,}900\)
Buyers want 5,150 dozen, but growers supply only 3,900. That's a shortage, or excess demand, of 1,250 dozen. On the graph, draw a horizontal line at $20, below the crossing point. Read off quantity supplied where the line meets the supply curve, and quantity demanded where it meets the demand curve. The gap between them is the shortage.
Normally, a shortage pushes the price up until it disappears. The ceiling makes that illegal, so the shortage persists. Fewer roses are sold than at the $25 equilibrium: 3,900 dozen instead of 4,900. Some buyers who would happily pay $20 or more go without. The roses that are sold have to be allocated some other way than by price, for example by who arrives first.